Data model: Overview of what we monitor and what metrics we produce
Understanding displacement dynamics
We strive to paint a comprehensive picture of all internal displacement situations in the world regardless of their cause, from the onset through to their resolution. Regardless of the cause of displacement we report on the situation using a set of common metrics including the number of new displacements, the number of IDPs at a given moment in time and the number of returns.
To do this, we collect data on and account for all the factors and processes that lead to increases or decreases in the size of displaced populations, including flows in and out of displacement, as well as onward, repeated/dynamic or cross-border movements.
Not doing so would mean we lose sight of what is happening to tens of millions of people around the world every year.
We have created a unique data model (figure below) to paint a comprehensive and accurate picture of displacement at any given point in time.
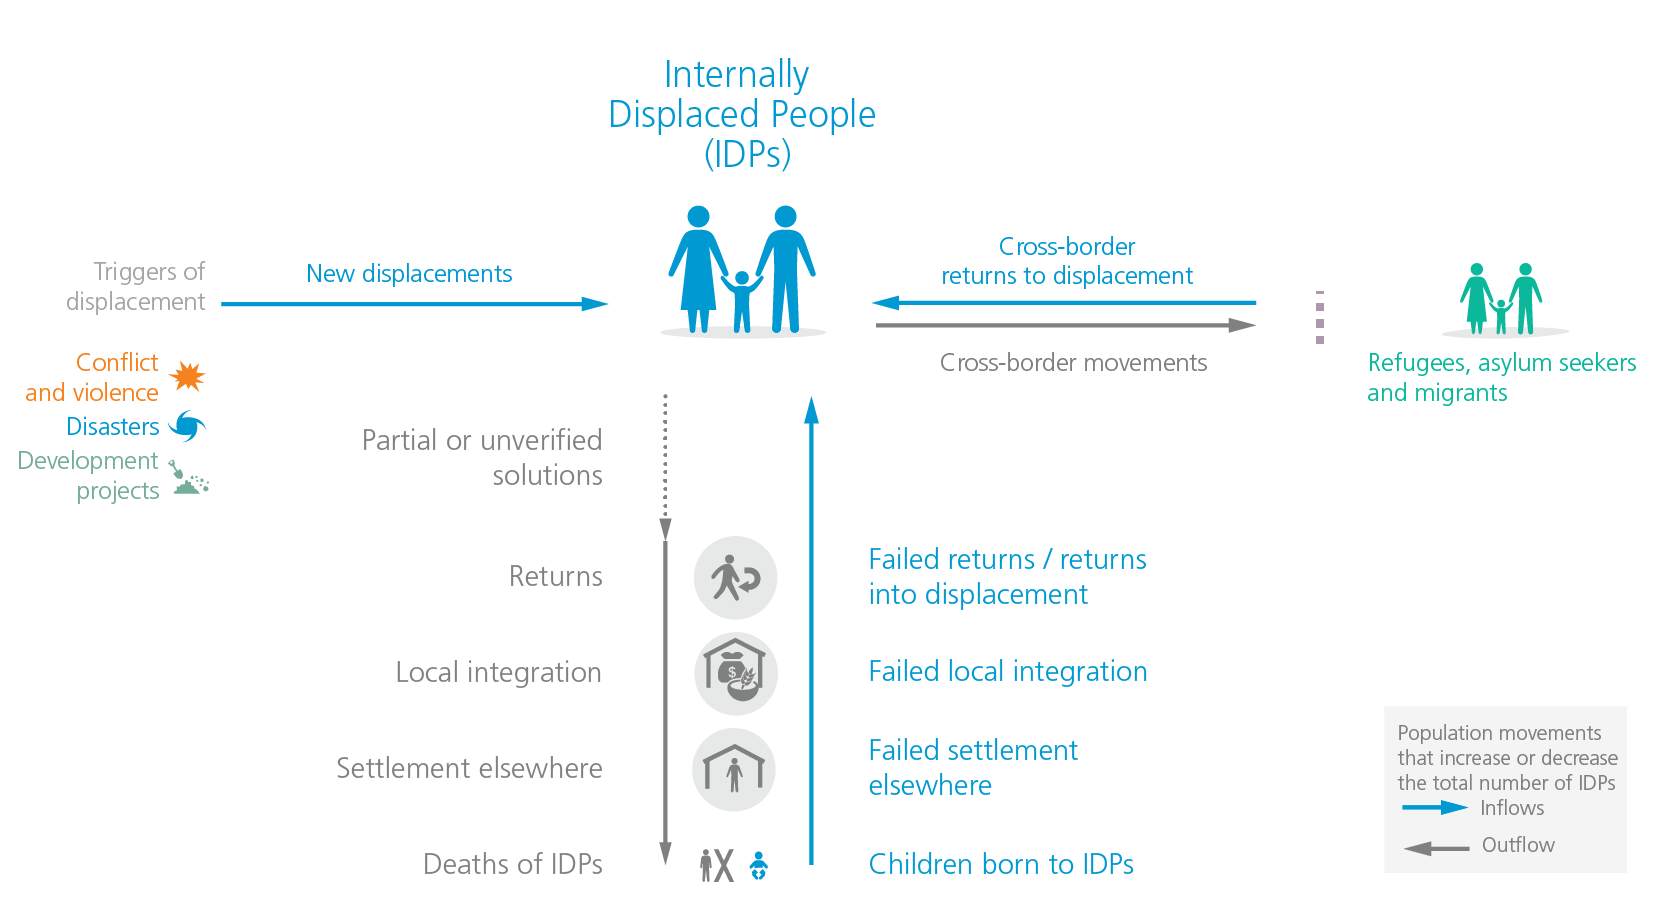
This data model enables us to map all of our partners’ data onto a common schema and report on it in a consistent manner. Doing so enables us to compare one country to another and to explain how each situation has evolved over time. The data model also helps us account for births and deaths and secondary movements of people already displaced, including flight across an international border. The data model can be expanded to account for refugee and migration flows so that we can eventually paint one full picture of forced human movements.